

Scripting
Count Days In A Transaction Using Intervalmatch
Version 1, Dec 5, 2013
Version 1, Dec 5, 2013
This example demonstrates using IntervalMatch to count the number of days in a transaction. The transaction days could be calculated in the script by computing EndDate-StartDate, but using IntervalMatch allows for flexible counting of subtotals across various date dimensions such as Month or Quarter.
The example data is for a rental company that rents out equipment. The input data is:
EquipmentId, DateOut, DateIn
Date Grouping
Version 3, Dec 5, 2013
Version 2, Dec 5, 2013
Assigning dates to temporal groups such as “Yesterday”.
This example demonstrates assigning dates to named range groups, such as “Today” or “This Month”. Note that a Date may belong to more than one group. For example, today’s date belongs to “Today”, “This Week”, “This Month”, “Last Two Months” etc.
V2 update adds group named “Next Workday”.
Delta Load Template
Version 1, Apr 20, 2015 - QlikView
This example provides a template script for building a delta (incremental) load script. A delta load fetches only new or changed rows from the database.
This template can handle all three common database update scenarios — Insert, Update and Delete.
Expand A Pricing Date Table
Version 1, Dec 5, 2013
Version 1, Dec 5, 2013
This example demonstrates using the Previous() function and WHILE clause to “fill in” values in a date range.
In this exercise, a transaction file provides Products, Prices, and the date the Price is effective.
The goal is to determine the Product Price for any given date.
List Files
Version 1, Dec 5, 2013
Version 1, Dec 5, 2013
This example lists information about disk files using the FileList() and DirList() script functions in conjunction with the FOR EACH statement.
A pattern and subroutine is defined to process multiple directories.
Load Input File Containing Multiple Record Types
Version 1, Dec 5, 2013
Version 1, Dec 5, 2013
Load and Merge data from an input file that contains multiple record types.
The test file has a phone number id record followed by some call detail records for that phone number and a total charges row. We want to associate the phone number with the detail rows.
Load Users and Groups from Active Directory
Version 1, Dec 5, 2013
Version 1, Dec 5, 2013
LOAD Users and Groups from Active Directory using AdsDSO.
This version uses no Macros.
See the script source for details and setup for your AD domain.
Loading Non Standard Numeric Signs
Version 1, Dec 6, 2019
Version 1, Dec 6, 2019
This receipe demonstrates how to read numbers that have non-standard number signing formats, for example a trailing “-” to indicate negative numbers or a keyword like “DEBIT”.
102-
400 DEBIT
Both should be interpreted as negative numbers.
-102
-400
Loading Varying Column Names
Version 1, Dec 10, 2018
Version 1, Dec 10, 2018
This example provides a script pattern for loading fields from multiple files, when the field names vary between files.
The same field name may use a different spelling between files.
There may also be extra fields in some files that should not be in the final data table.
Mapping With Wildcards
Version 2, Oct 30, 2018
Version 2, Oct 30, 2018
Mapping values using a table with wildcards.
Sometimes you want to use QV mapping to group values. The QV MAPPING LOAD / MAP USING / APPLYMAP is excellent for this. However, sometimes you have many different values to map and a comprehensive map is not available. This sample presents a technique where wildcard characters may be used in the mapping table to simplify the map definition.
Perfmon QVD
Version 1, Feb 5, 2014 - QlikView
This is a generalized script to created a QVD file from Windows Performance Monitor csv file(s).
The script will discover and create a QVD field for every Perfmon Counter found in the csv files. Dimension Fields for DateTime, Group and Instance will be created as well.

Regular Expression Pattern Matching
Version 1, Dec 5, 2013 - QlikView
Qlikview script contains many powerful and useful string functions. But sometimes you want the power of Regular Expression (RegExp) pattern matching. QV does not yet provide a native Regular Expression function.
This sample uses a very simple macro that uses VBScript to provide a RegExp pattern matching function in QV script.
Strip HTML From Text
Version 2, Oct 29, 2015 - QlikView
Extracting content from HTML using a module script function.
The function “ExtractInnerHtml” used in the script is written in the document module using the VBScript Regular Expression object. To view or modify the function definition, open the Module Editor (Ctrl-m).
Time Grouping
Version 1, Aug 13, 2023
Version 1, Aug 13, 2023
This example demonstrates assigning times to named range groups, such as “Midnight Shift” or “Early Evening”. This facilitates making selections by meaningful names, for example selecting events that occurred during a manufacturing shift.
Note that a Time may belong to more than one group and intervals may overlap.
Trailing Minus
Version 1, Dec 5, 2013 - QlikView
Some systems produce display numbers using a trailing minus sign. Qlikview expects a leading minus sign to indicate negative numbers.
This expression is one way to read numbers with trailing minus signs. It will work with both leading and trailing minus signs.
Tutorial - Using Common Date Dimensions
Version 1, Dec 5, 2013
Version 1, Dec 5, 2013
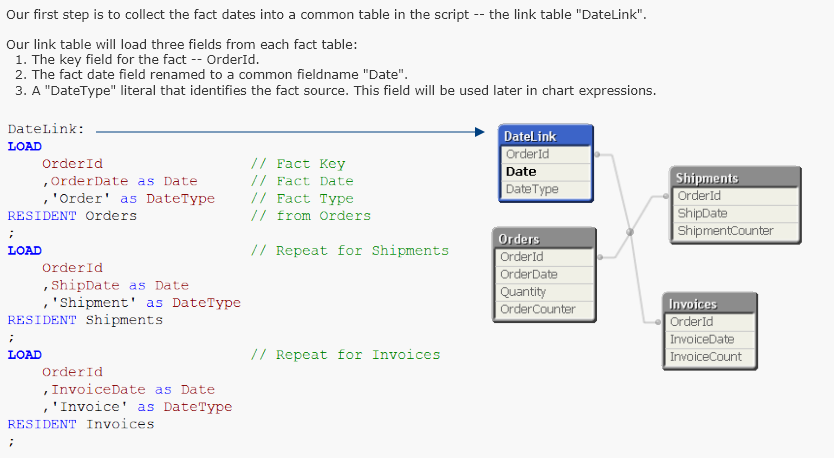
This tutorial presents a script pattern for assigning time dimensions to multiple fact dates in a data model.
The pattern will demonstrate how to link all fact dates to a common calendar as well as using separate calendars for each fact date.


Click image to enlarge
Visualization


Conditional Show of Details
Version 2, Nov 15, 2015 - QlikView
This example demonstrates using the Conditional Show property to show additional Charts and Text Objects after selecting to a single item.
Revision 2 of this recipe demonstrates showing additional charts after clicking in a bar chart.


Defer Selections Until Apply
Version 1, Dec 4, 2015 - QlikView
There may be unusual cases where you want to the user to make multiple selections before calculating charts(s).
This example demonstrates how you can collect proposed selections in an alternate state and defer applying those selections to charts until the user presses “Apply”.


Focus not Filter
Version 1, Feb 3, 2015 - QlikView
This example demonstrates various techniques to emphasize selected data while still keeping all data in view.
More information can be found in the blog post “Focus not Filter” .


How to Choose an Expression
Version 1, Dec 19, 2014 - QlikView
This example demonstrates a technique for improving the performance of a large document when a chart needs to choose one of several expressions based on user selected options.
Complete explanation can be found in this post “How to Choose an Expression“.


Multivariate Analysis Example
Version 1, Feb 21, 2018 - Qlik Sense
This example accompanies the blog post “QDG Guru Day Inspiration“. The example demonstrates using color encoding in a scatter chart to display two inter related dimensional series.


Pivot Table Grids
Version 1, Nov 9, 2015 - QlikView
This recipe provides examples of using a Pivot Table to display data in a grid. The second dimension is dragged to the horizontal creating a cross table.
The Pivot Table provides more options than a Grid chart for representation.


Click image to enlarge
Scoping Selections
Version 1, Jan 25, 2016 - QlikView
This example shows how the Aggr() function can be used to narrow or widen selections from a Calculated Dimension.
More on this topic can be found in the blog post “Scoping Selections with Aggr“.


Tutorial - Annotating Chart Data Points
Version 2, Feb 17, 2014 - QlikView
Annotations are comments or labels placed in a chart to provide additional meaning or interpretation of chart data. Text is placed on a data point or connected visually to the point.
This tutorial will demonstrate techniques for annotating data points in Qlikview Charts.

Using Alerts To Send Numbers Via Email
Version 1, Jan 8, 2014 - QlikView
The Qlikview document Alert feature can be used to send text emails with KPIs like “daily numbers” after document reload.
This example shows how to configure an alert and craft an alert text message.
Alerts may not be used to email graphical charts or attachments. Only text may be sent.

