Category Archives: QlikView

QV12 Timestamp Parsing

Have you noticed something new in QlikView12 and Qlik Sense timestamp parsing? UTC timestamps are automatically understood.

(Note: the output displayed below utilizes the US Date format set in the script as:  SET TimestampFormat=’M/D/YYYY h:mm:ss[.fff] TT’;)

For example, the expression:

=Timestamp('20160504T142523.487-0500')

returns:

5/4/2016 7:25:23 PM

That is, the UTC offset of “-0500” is detected and the returned value is the UTC time, not the local time of 2:25:23 PM.

I can’t find anything in the help beyond an example  for Timestamp# that demonstrates this but provides no detail.

This parsing functionality is particularly useful now that the QlikView Server logfiles use the UTC format for times.

I’m not sure yet if I like the automatic conversion to UTC time.  For example, apps like the QlikView Governance Dashboard now report Session Start or Event times in UTC time, not local time.

It’s nice that the “T” character is understood. If you want local time, it’s easy enough to drop the offset (“-0500”) as

=Timestamp(left('20160504T142523.487-0500', 19))

which returns

5/4/2016 2:25:23 PM

-Rob


Share

Scaling Numbers and DSE Tips

Summary: I demonstrate a simple reusable expression to auto scale numbers in QlikView. This leads to an exploration of some of the finer details of dollar sign expansion.

A QVW example to accompany this post is available for download at http://qlikviewcookbook.com/wp-content/uploads/2016/05/ScalingNumbers.qvw.

The QlikView auto-scaling feature selects an appropriate unit – billion, million, thousands — based on the magnitude of the  Y-axis values.  It’s a nice feature  available in Line and Bar charts.  How can we create the same functionality in Text Objects or Straight Tables?

It’s easy enough to use an if() function that tests the magnitude, does any necessary division, and formats appropriately. For example:

if(Sum(Sales)>1E6, num(Sum(Sales)/1E6,'$#,##0.000M')
 ,if(Sum(Sales)>1E3, num(Sum(Sales)/1E3,'$#,##0.000K')
 ,num(Sum(Sales),'$#,##0')
 ))

(The 1E6 is an easier way to write 1000000).

To avoid repeated coding of “Sum(Sales)” I create a reusable variable with parameters in the script like this:

SET vScaleNumber=if($1>1E6, num($1/1E6,'$#,##0.000M')
 ,if($1>1E3, num($1/1E3,'$#,##0.000K')
 ,num($1,'$#,##0')
 ));

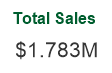
Now I can use the variable vScaleNumber in a Text Object as:

=$(vScaleNumber(Sum(Sales)))

The string “Sum(Sales)” will get substituted in  every occurrence of “$1”.  I ‘ll get an appropriately formatted number like:

If I use “$(vScaleNumber(Sum(Sales)))” in a Straight Table expression without label, hovering over the column heading will show me the full substitution in  a tooltip.

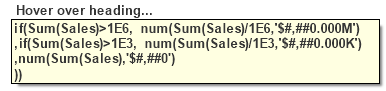
I  can see that the “$1” substitution occurs before the expression is evaluated, and the substituted expression looks like:

if(Sum(Sales)>1E6, num(Sum(Sales)/1E6,'$#,##0.000M')
 ,if(Sum(Sales)>1E3, num(Sum(Sales)/1E3,'$#,##0.000K')
 ,num(Sum(Sales),'$#,##0')
 ))

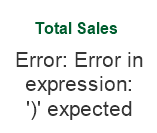
I’ve avoided re-typing “Sum(Sales)”. But I may have a concern about the performance implications of repeated execution of “Sum(Sales)”.  And what about more complex expressions such as “Round(Sum(Sales),10)”?  The comma in that expression will break the syntax as variable parameters always treat commas as parameter separators.

I can fix the comma/performance problem by using Dollar Sign Expansion (DSE) with an “=”.  The “=” will cause the expression to evaluate and pass the numerical result to vScaleNumber.

=$(vScaleNumber($(=round(Sum(Sales),10))))

Checking the expansion in a Straight Table shows:

if(1783150>1E6, num(1783150/1E6,'$#,##0.000M')
,if(1783150>1E3, num(1783150/1E3,'$#,##0.000K')
,num(1783150,'$#,##0')
))

I  see the value of “round(Sum(Sales),10)” has been calculated as “1783150”,  yielding an efficient and syntactically correct expression.

Next  I’ll add a Dimension to the Straight Table.  The row results are incorrect!

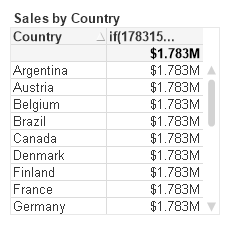
The “=” in the DSE caused the Sum expression  to be evaluated only once for the entire chart, yielding the same value for every row.  How to fix?

I will calculate the sum() expression in a n Expression n column, and then hide this column on the Presentation tab. I can then refer to the hidden column:

=$(vScaleNumber(Column(1)))

Once again, the expansion yields an efficient and syntactically correct expression.

if(Column(1)>1E6, num(Column(1)/1E6,'$#,##0.000M')
 ,if(Column(1)>1E3, num(Column(1)/1E3,'$#,##0.000K')
 ,num(Column(1),'$#,##0')
 ))

I started this post by demonstrating a simple expression to format scaled numbers. It’s a function I frequently use.

For more on DSE, see Henric’s post at https://community.qlik.com/blogs/qlikviewdesignblog/2013/11/18/dollar-expansions

A QVW example to accompany this post is available for download at http://qlikviewcookbook.com/wp-content/uploads/2016/05/ScalingNumbers.qvw.

-Rob

Share

Scoping Selections with Aggr()

Summary: Selections can be made in Calculated Dimensions, although the result may not always be what is expected or desired.   The Aggr() function can be used to control what field(s) get selected.

The technique discussed in this post applies to both QlikView and Qlik Sense.  The screenshots shown are from QlikView.  Some of the visuals are a bit different in Qlik Sense, but the idea and expressions demonstrated are the same.

A downloadable example to accompany this post is available here.

Consider a listbox created with an <Expression> value of:

=Customer & ' -- ' & Country

A listbox constructed this way is useful for providing additional context or an  additional search.

Selections made in that listbox will make underlying selections in both Customer and Country.

The user is probably  expecting a selection in Customer only.  To limit the selection to Customer, add an Aggr() function to the expression:

=aggr(
 Customer & ' -- ' & Country
 ,Customer)

Only the Customer field is listed in the Aggr() dimension, so selections will be made only in Customer.

A side effect of adding Aggr() is that gray (unassociated) rows no longer display.  We can fix that with a bit of Set Analysis.

=aggr(
 only({1<Customer={"*"}>} Customer & ' -- ' & Country)
 ,Customer)

Now the listbox looks and behaves as expected.


Another place you may need Aggr() to control selection intent is chart Calculated Dimensions.

Hovering over a Salesrep value in the chart below gives a contextual popup that identifies Manager and Hire Date associated with the Rep.

The column was created as a Calculated Dimension:

=SalesPerson
& chr(10) & 'Reports to ' & [Sales Manager]
& chr(10) & 'Hire Date ' & date(HireDate,'YYYY-MMM-DD')

Clicking Michelle in the chart correctly selects her name as SalesPerson, but makes unexpected selections in HireDate and SalesManager.

I’m going to say that the dimension is “improperly scoped” and correct it by adding Aggr() to the Calculated Dimension.

=Aggr(
 SalesPerson
 & chr(10) & 'Reports to ' & [Sales Manager]
 & chr(10) & 'Hire Date ' & date(HireDate,'YYYY-MMM-DD')
 ,SalesPerson)

Selections will now be correctly limited to the “SalesPerson” field.


We’ve seen that Aggr() can narrow selections. We can widen selections as well.  This listbox will make selections in Customer, Country, SalesPerson and Year, even though only Customer is displayed in the listbox.

=aggr(
 only({1}
 Customer
 )
 ,Customer, Country, SalesPerson, Year)


We don’t have to include the display field in the selections.  In what I’ll call a  “backdoor associative search” , this expression will display Customer, but selects only the OrderID values associated with the Customer.

=aggr(
only({1}Customer )
,OrderID)

It’s usually a best practice to pre-create Calculated Dimensions in the script, when possible, for performance reasons. Returning to our first example, we might create a new field in the script as:

Customer & ' -- ' & Country AS CustomerAndCountry

We can use the new field as a display value, but we want selections to be made in Customer.

=aggr(
 only({1}  CustomerAndCountry)
 ,Customer)


As a last example,  we can create  “bookmark” like alternatives; either new fields linked in the data model or advanced search at run time.

Here I’ve linked a hidden field named “Bookmark” into specific OrderIDs in the script.  I want selections to be reflected in the OrderID field.

=aggr(only({1}Bookmark), Bookmark,OrderID)

Here is an advanced search that presents a listbox of Customers who have placed at least one order with a value >50K.

=aggr(
only({1<OrderID={"=sum({1}OrderAmount)>50000"}>}Customer )
,Customer)

Aggr() can be a “heavy resource consumer” and has the potential to slow down your application. Use only when required and avoid using or benchmark the impact in large applications.  Calculated Dimensions can also be a source of slow performance, precalculate fields in the script when possible.

Download the  example qvw for this post .

-Rob


Share