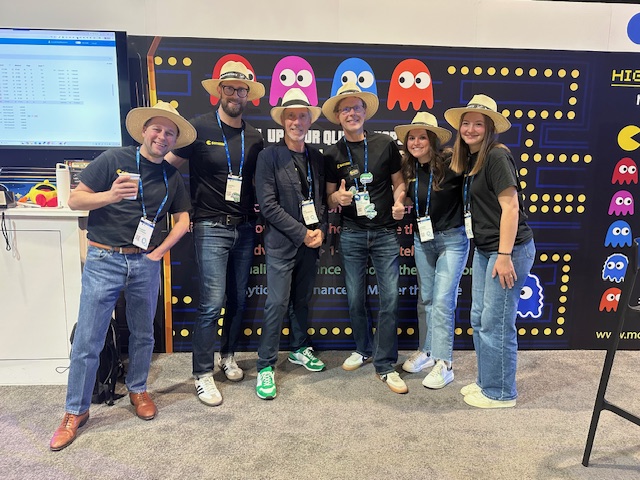
What a great week at QlikConnect 2026. Interesting announcements, stimulating discussions and catching up with old friends. I had a great time with my Motio colleagues meeting customers and sharing our solutions.
Here are a few of my takeaway thoughts.
AI Readiness
I was struck by the keynote theme that “Qlik customers are closer to agentic AI than they think”. Trusted data is the foundational prerequisite for using AI. Most Qlik customers are well along on that journey. Our data models are gold. If trusted data is the foundation, what kind of supports do we need to build on top of that?
Implementation of analytics AI will require investment in guardrails, observability, data sovereignty, additional contexts and building trust.
Building trust is achieved through a combination of competence, learning, success and time. Yes, it takes time.
Implementation of supervised agentic AI — AI taking actions in conjunction with a human — will require a greater level of the aforementioned structural supports. Much more context, especially about other systems and data, will be required.
Unsupervised agentic AI — taking actions without human intervention — will require higher levels still.
Successfully validating and guiding AI requires discernment that comes from a deep knowledge of the business domain.
The announced Qlik Semantic Catalog will be a critical piece in defining and provisioning the increased contexts required for agentic AI to succeed.
Implementing agentic AI using Qlik features may be the fastest and most reliable way for Qlik customers to roll out agentic.
If you want to follow along with a real life case study of agentic AI, check out Major League Baseball’s rollout of automated calling of balls and strikes (“RoboUmp”). The story has it all, value proposition, building trust, phased implementation, course corrections, labor and culture disruptions. I enjoyed this podcast on the topic https://99percentinvisible.org/episode/663-roboump-hits-the-big-leagues/.
Chat AI is the new Excel
Where users were asking “Can I get this in Excel?” they are now asking “Can I get this in Claude?”. Embrace it.
Disruptions
There will likely be significant societal disruptions from Agentic AI. Increases in water and power consumption. Shifts in the labor market including displaced jobs, geographic relocation of business resources and increased social isolation. New and unforeseen policy and legal issues to work out.
If Agentic AI takes over the tasks performed by junior employees, how will we develop institutional knowledge in future leaders? Will they be able to attain the required levels of discernment? I’m reminded of dystopian sci-fi stories like “Silo” where the inhabitants of a future civilization are meticulously following rules inherited from “old-earth” but they have no idea why the rule exists.
These disruptions may follow the arc of the Industrial Revolution where displacing craft workers with machines wrought enormous disruption in the social fabric but eventually settled into increased prosperity and welfare.
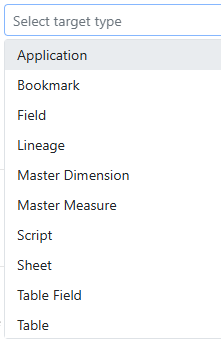
Qlik App Generation
LLMs are poor at generating Qlik App artifacts like Qlik script because they have limited data to train on. It’s unlikely we could expose enough real world examples to catch up. The solution may be to rethink how things like data models are built. For example, could we build data models using languages well known to LLMs such as python?
Training a private LLM to the competency of a Qlik-Dev seems impractical today. Providing a structured bridge like MCP may be a solution that would allow us to use LLM reasoning to invoke the correct tools but not expect AI to write the final code. I won’t be surprised if another leap in AI tech presents additional paths.
After Qlik Connect 2024 I postulated that Gen AI could eliminate the need for visual analytics charts as used in the analysis process. I believe this is where we are heading. Dashboards and reports will still exist, but the analytics function itself will change. I see much of the analysis process moving into chat and the charts generated there would be simple illustrative charts to support the current conclusion. I definitely heard some counter opinions this week.
Thanks to Qlik for putting on such a well run and informative event, and thanks to all who took the time to sit down with me and chew on these ideas.
-Rob