What a great week at QlikConnect 2026. Interesting announcements, stimulating discussions and catching up with old friends. I had a great time with my Motio colleagues meeting customers and sharing our solutions.
Here are a few of my takeaway thoughts.
AI Readiness
I was struck by the keynote theme that “Qlik customers are closer to agentic AI than they think”. Trusted data is the foundational prerequisite for using AI. Most Qlik customers are well along on that journey. Our data models are gold. If trusted data is the foundation, what kind of supports do we need to build on top of that?
Implementation of analytics AI will require investment in guardrails, observability, data sovereignty, additional contexts and building trust.
Building trust is achieved through a combination of competence, learning, success and time. Yes, it takes time.
Implementation of supervised agentic AI — AI taking actions in conjunction with a human — will require a greater level of the aforementioned structural supports. Much more context, especially about other systems and data, will be required.
Unsupervised agentic AI — taking actions without human intervention — will require higher levels still.
Successfully validating and guiding AI requires discernment that comes from a deep knowledge of the business domain.
The announced Qlik Semantic Catalog will be a critical piece in defining and provisioning the increased contexts required for agentic AI to succeed.
Implementing agentic AI using Qlik features may be the fastest and most reliable way for Qlik customers to roll out agentic.
If you want to follow along with a real life case study of agentic AI, check out Major League Baseball’s rollout of automated calling of balls and strikes (“RoboUmp”). The story has it all, value proposition, building trust, phased implementation, course corrections, labor and culture disruptions. I enjoyed this podcast on the topic https://99percentinvisible.org/episode/663-roboump-hits-the-big-leagues/.
Chat AI is the new Excel
Where users were asking “Can I get this in Excel?” they are now asking “Can I get this in Claude?”. Embrace it.
Disruptions
There will likely be significant societal disruptions from Agentic AI. Increases in water and power consumption. Shifts in the labor market including displaced jobs, geographic relocation of business resources and increased social isolation. New and unforeseen policy and legal issues to work out.
If Agentic AI takes over the tasks performed by junior employees, how will we develop institutional knowledge in future leaders? Will they be able to attain the required levels of discernment? I’m reminded of dystopian sci-fi stories like “Silo” where the inhabitants of a future civilization are meticulously following rules inherited from “old-earth” but they have no idea why the rule exists.
These disruptions may follow the arc of the Industrial Revolution where displacing craft workers with machines wrought enormous disruption in the social fabric but eventually settled into increased prosperity and welfare.
Qlik App Generation
LLMs are poor at generating Qlik App artifacts like Qlik script because they have limited data to train on. It’s unlikely we could expose enough real world examples to catch up. The solution may be to rethink how things like data models are built. For example, could we build data models using languages well known to LLMs such as python?
Training a private LLM to the competency of a Qlik-Dev seems impractical today. Providing a structured bridge like MCP may be a solution that would allow us to use LLM reasoning to invoke the correct tools but not expect AI to write the final code. I won’t be surprised if another leap in AI tech presents additional paths.
After Qlik Connect 2024 I postulated that Gen AI could eliminate the need for visual analytics charts as used in the analysis process. I believe this is where we are heading. Dashboards and reports will still exist, but the analytics function itself will change. I see much of the analysis process moving into chat and the charts generated there would be simple illustrative charts to support the current conclusion. I definitely heard some counter opinions this week.
Thanks to Qlik for putting on such a well run and informative event, and thanks to all who took the time to sit down with me and chew on these ideas.
QSDA Pro 3.6 introduces Custom Flags — a way to enforce your organization’s unique standards alongside QSDA’s built-in analysis.
In addition to built-in QSDA flags that expose findings like errors and best practices, you can now define additional flags specific to your site.
Do you have unique company standards like:
Every App and master measure should have a description?
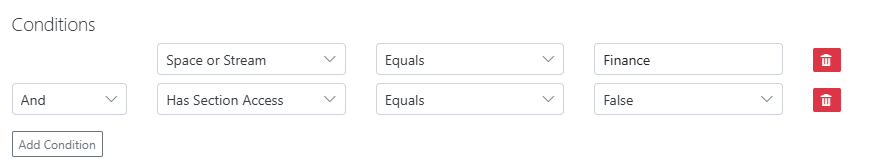
Apps in the Finance stream should have Section Access enabled?
Mobile Apps should have no more than ten objects per sheet?
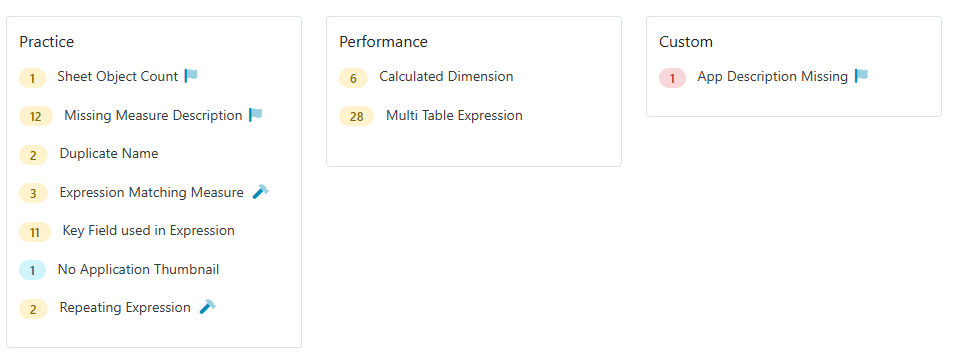
You define the triggering condition, flag category and detailed flag description. Any triggered flags will appear in QSDA alongside the built-in flags. Custom flags use a distinctive icon to distinguish them from built-in flags
You can assign the new flag to one of the built-in categories like “Practice” or assign to the new “Custom” category.
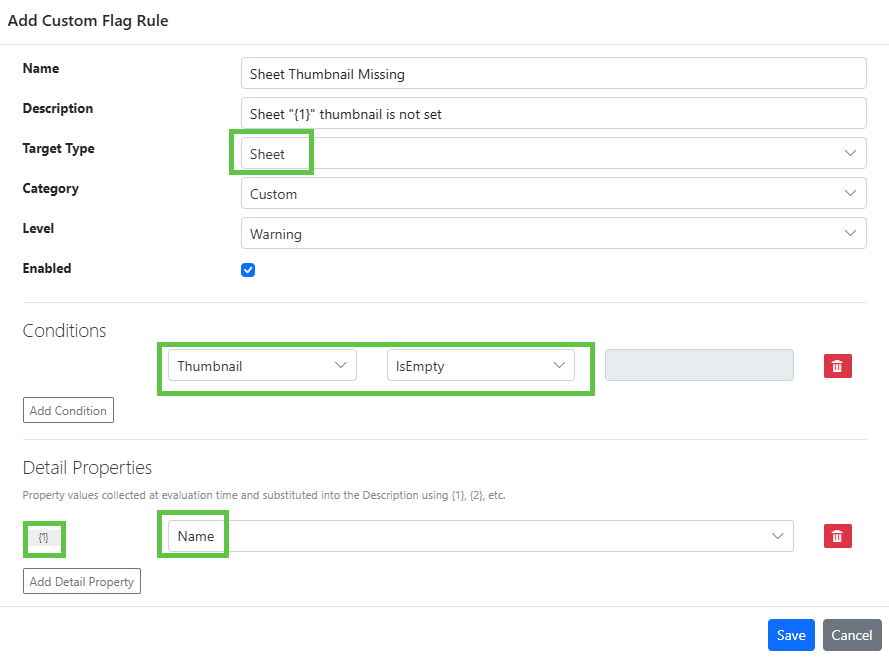
Create and edit rules under Admin > Custom Flags
In the rule above, we define that every Sheet must have a thumbnail. When we select a Target Type of Sheet, properties of Sheet are made available in the Conditions and Detail Properties dropdowns. QSDA evaluates these conditions during analysis and raises the flag when they are met.
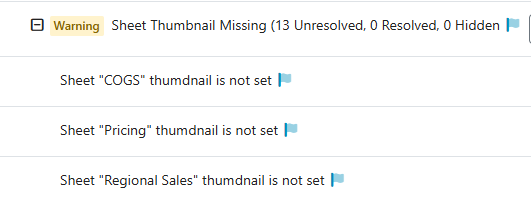
The Detail Properties are used to collect {n} placeholder values that can be substituted in the Description field. When this flag is raised in the QSDA analysis, the Description placeholder will be filled in like this.
You may have multiple conditions defined with and/or.
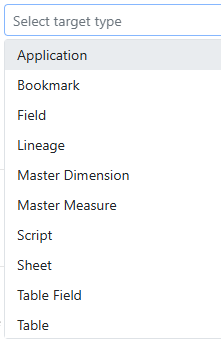
We’ve done our best to expose the data we think customers will need for rules. We currently expose these Target Types:
Each target type offers a number of different properties. If we missed something you need or you just have a question about how we can meet a specific requirement, please reach out to our friendly Motiosupport team.
While we have an increasing number of methods to create Qlik Data Models, most are still created using plain old script and we care about the elapsed runtime of the script.
Qlik QVD files load very fast when loaded in “optimized mode”. An optimized load can transfer the data from disk directly to Qlik’s internal memory format and is generally about 10x faster than a non-optimized load. A QVD is loaded optimized if:
No fields are added
No field transformation
No Where clause except for single parameter Exists(), or two parameter Exists() where both fields are in this Load.
Field Rename using AS is allowed
There are some common script requirements, e.g. filtering a QVD on a year value, that will break the optimization. What follows are some typical scenarios and script patterns to help you maintain optimized Loads.
Script patterns that let you maintain optimized Load can be:
Use Where Exists() to select rows. Subsetting with Join is possible but slower and uses more memory.
Use a subsequent Load Resident to add calculated fields.
AutoNumber statement
Touchless formatting vs inline formatting.
Selecting QVD Rows
The optimal pattern for filtering rows from a QVD is to load a temp table with values and filter the QVD load using Where Exists(field).
TempYear:
LOAD * INLINE [
Year
2022
2023
];

Data:
LOAD *
FROM [lib://data/sales.qvd] (qvd)
Where Exists(Year)
A slower option that allows for more conditions is an Inner Join.
Data:
LOAD *
FROM [lib://data/sales.qvd] (qvd);

INNER JOIN (Data) LOAD * INLINE [
Year, Region
2022, US
2023, US
];
When you want two separate tables that contain only intersecting rows with multiple fields, you can’t use Where Exists(field). Instead use the Keep prefix.
For example, Table “RepairOrders” has already been loaded. “RepairOrders” contains fields ModelId and PartId, linking to “PartsMaster.qvd”. Load matching rows from PartsMaster as a separate table, keeping the load optimized.
PartsMaster:
LEFT KEEP(RepairOrders)
LOAD *
FROM [lib://data/ParstMaster.qvd] (qvd);
Subsequent Load Resident
Create additional derived fields in a Load Resident after the optimized QVD Load.
TempSales:
LOAD *
FROM [lib://data/sales.qvd] (qvd);

Sales:
LOAD *,
  Total - Cost as Margin
Resident TempSales;

Drop Table TempSales;
If you are certain your table contains no duplicate rows, you can create the new fields using Join instead of creating a new table:
Join (Sales) LOAD *,
  Total - Cost as Margin
Resident Sales;
AutoNumber Statement
It’s usually a good idea to AutoNumber key fields to save memory. Don’t use the AutoNumber() function in a Load. Instead use the AutoNumber statement at the end of the script.
AutoNumber *fieldlist;
Note that you can use wildcards in the fieldname. This is really handy if your keyfields follow a naming pattern like “Key*”.
Touchless Formatting
“Touchless formatting” is my invented term for the technique of formatting fields by using a temp format table. This is useful when you need to change or set specific date or number formats for a QVD fields. If you add the formatting function to the QVD Load, you lose the optimized Load. You can read more about Touchless Formatting here.
Here is an example of changing the EU format dates in QVD fields to US format dates.
// Load some dummy fields just to assign formats
TempFormatTable:
LOAD
 Date(0, 'MM/DD/YYYY') as OrderDate,
 Date(0, 'MM/DD/YYYY') as ShipDate,
 Num(0, '#,##0.00') as OrderTotal
AutoGenerate 1;

Facts: // Load the QVD
LOAD * FROM [lib://data/OrdersEU.qvd] (qvd);

DROP TABLE TempFormatTable;  // Drop temp table
I hope you’ve found these tips a useful reference. Happy Scripting!
QSDA Pro 3.4 was recently released and here’s a roundup of some cool new features.
QSDA Pro is a quality tool for Qlik Sense Apps. QSDA uncovers errors, advises on best practices and provides powerful tools to optimize your Qlik Apps and minimize your development time.
Apply Recommendation
Now QSDA not only makes recommendations to improve your App, but in many cases offers to make the changes for you! Pressing the “Apply Flag Recommendation” button will update your Qlik App with the recommended change — in this example replacing a free form expression with a Master Measure.
As always, QSDA is smart enough to make matches using the logical meaning of the expression rather than a limited text match.
Learn more and see “Apply Recommendation” in action in this video here.
Load Script
As requested by several customers, we are now collecting the Load Script for reference and viewing within QSDA. It’s presented in it’s multi-tab format and a search across tabs function is provided.
Deprecated Visualizations
A new flag “Deprecated Visualization” is raised for any visualization that Qlik has listed in a deprecation notice. For example, the Multi KPI. This will give your team a heads up to consult the Qlik doc for replacement options.
HTML Report
A new HTML Report option in Tools generates a formatted report from your analysis. You can use this generated report to share results outside of QSDA or serve as an artifact in your change management process.
Large App List Performance
For large App Lists we’ve instituted streamed results and paging to make the list more manageable. We still recommend you use the connection filters to focus the list to specific streams or spaces but we understand that doesn’t work for everyone.
Read the entire list of changes and usability improvements here
The 25th (!) edition of the Masters Summit for Qlik will take place in Hamburg Germany 29 September to 1 October.
Continuing our focus on Qlik Cloud, this three day education event will take you through lectures and hands on exercises to help you master the features and operation of Qlik Cloud Analytics.
In addition to the scheduled presentations you’ll have time to network with other attendees and the team of Masters Summit Presenters, opportunities to discuss challenges faced and learn about practical solutions.
Summary: A rich set of regular expression functions has recently been added in Qlik Sense cloud and client managed. In this post I’ll introduce some use cases for this feature and show how to instantly become a regular expression master.
Regular Expressions (RegEx) is a powerful string pattern matching language that has been available in many programming and scripting languages for decades. Qlik Sense Cloud and the client-managed May 2025 release brings the full power of RegEx to Qlik via a new set of Chart and Load Script functions.
What can you do with RegEx?
Validate that a field value matches a specific pattern. e.g. Is this a valid phone number or credit card?
Extract substrings from a larger string.
Reformat a string to match your rules.
Here’s an example to get us started. I’ll validate that “Phone” values match the allowed format for US phone numbers.
The string ‘^(?:([2-9]\d{2})\ ?|[2-9]\d{2}(?:-?|\ ?))[2-9]\d{2}[- ]?\d{4}$’ is a regular expression pattern that represents the validation rule for US phone numbers. Like any powerful and syntactically terse programming language, RegEx patterns can look a little daunting at first. Here’s the explanation of what that pattern enforces.
This regular expression for US phone numbers conforms to NANP A-digit and D-digit requirements (ANN-DNN-NNNN). Area Codes 001-199 are not permitted; Central Office Codes 001-199 are not permitted. Format validation accepts 10-digits without delimiters, optional parens on area code, and optional spaces or dashes between area code, central office code and station code. Acceptable formats include 2225551212, 222 555 1212, 222-555-1212, (222) 555 1212, (222) 555-1212, etc.
Did I write that pattern myself? No, I copied it off an internet site. There are many internet repositories with thousands of patterns you can copy from. Those repositories have quickly been supplanted by AI chatbots.
Let’s look at another example. I recently answered a question on Qlik Community where the poster wanted to extract First & Last names from strings like:
James SmithMary JohnsonJohn WilliamsPatricia BrownRobert Jones-GarciaMichael MillerLinda Davis
The Qlik function ExtractRegEx is the function we want to use. I know enough RegEx off the top of my head to create a pattern to split on the capital letters and spaces. But how do I deal with the hyphen in “Jones-Garcia”? It would make my head hurt.
AI is a great tool for generating RegEx patterns! Turn to your AI chatbot of choice. I use Copilot but I expect ChatGPT or any of the popular bots would do the job as well.
Asking Copilot to generate the pattern
The nice thing about this approach is I don’t have to explicitly state “..and handle hyphens”, I just supply sample data.
Is this pattern correct? You could just plug it into Qlik but I prefer to first validate using a RegEx tester. There are a number of free tools, regex101.com is the one I usually use.
After validating and potentially tweaking the pattern we use it in Qlik script like this:
I do recommend you spend 30 minutes learning the basics of RegEx to make best use of assistants and testing tools.
You may have used the Qlik script SubField function to split a string in multiple rows based on a delimiter such as a comma. But SubField won’t do when comma is part of a quoted string as is common in CSV files. The new SubFieldRegEx function handles this with ease.
Don’t quit if RegEx only gets you 90% of the way there. Stack some Qlik functions like the where clause above to finish the job.
RegEx implementations in other languages use an option flag to indicate a case-insensitive operation. Qlik has opted to use an additional function with the suffix “l” to indicate a case-insensitive operation. So:
MatchRegEx – case sensitive
MatchRegExl – case insensitive
A really nice feature of the Qlik MatchRegEx function is that it allows for multiple match patterns to be specified.
The Qlik RegEx functions are documented in the String Functions section. I do wish they had given the functions a separate section. I’ll summarize the available functions here with the caveat that these are correct at this time of this posting.
ExtractRegEx() extracts text from an input string expression using the specified regular expression pattern. The function returns a null value if no matches are found.
IndexRegEx() searches the input string and returns the starting position of the nth occurrence of the specified regular expression pattern.
MatchRegEx() compares the input string with one or more specified regular expression patterns, and returns the numeric location of the regular expression patterns that match.
ReplaceRegEx() returns a string after replacing one or more matches between an input string and a specified regular expression pattern.
SubFieldRegEx() extracts text from an input string expression, using the specified regular expression pattern as a delimiter.
There are a number of useful optional parameters, see the documentation for details. There is also ReplaceRegExGroup that I have not yet wrapped my head around. Feel free to post a use case in the comments.
Are you going to use these functions a lot? Probably not. But when you need to clean messy data or extract relevant data these functions can be invaluable. I’ll leave you with one last example, extracting data within HTML tags.
I was recently helping a colleague debug a problem where Section Access in a Qlik app was not working correctly. It was not allowing access to listed users. Amongst other script he had an Inline load that looked something like this:
I pointed to the values of the USERID field and said “There’s your problem. The USERID values have to be in upper case. All values in a section access table have to be in upper case. It’s in the Doc”.
“No…” he replied, and proceeded to show me other Apps that used lower case USERID values and did work correctly. I looked at a few of my own apps and found some with lower case values, working correctly.
Why did the problem App fail while others worked? What was different? The difference is that in the problem App, the Load Inline occurred in Section Application and was subsequently Loaded Resident in Section Access. So what? I would have never found the cause but for a Qlik Community post from 2012.
When Load Inline is used within the script Section Access “section”, all data is automatically transformed to upper case.
Whoa! Double whoa!
Load sources other than Inline are not transformed in Section Access. And the magic transformation doesn’t happen in Section Application. I’ve never seen this behavior in the Qlik Doc.
Did everyone know this but me? Is it documented somewhere?
QSDA Pro 3.3 was recently released. Here are a few of the key features in this release.
The UI is available in Portuguese, Spanish and English.
The compact Applist displays more metrics. You can work with multiple apps and analyses in less screen space.
App memory footprint is part of the top level Applist. The memory value is highlighted when the app memory exceeds a configurable percentage of your tenant quota.
Optionally filter connections by stream or space name, or space type.
“Repeating Expression” is a new flag raised when an expression appears repeatedly in the app. The recommendation is to create and use a Master Measure.
Under the hood 3.3 contains several improvements that make the UI faster and simplifies setting up connections.
Read all the changes in 3.3 and previous releases here
Version 3.3 is the recommended release for all QSDA Pro customers. If you are upgrading from QSDA V2 be sure to read the V3 Upgrade Considerations.
Feel free to reach out to Motio Support if you have any questions about upgrading or configuring your QSDA Pro install.
Summary: A look at techniques to reduce the memory footprint of your Qlik Data Models.
There are good reasons to reduce the memory footprint of your Qlik Apps. Smaller Apps tend to perform better and require fewer server resources. Qlik Cloud imposes size quotas and there is a financial cost to exceeding the quota.
In this post we’ll look at techniques to reduce the memory requirements of your data model.
First, lets review how Qlik Sense stores App data in memory.
The Qlik Load script transforms your data into two types of internal data structures.
A Symbol Table is created for each field. The Symbol table contains a list of the distinct values of this field. The overall size of the symbol table is therefore a function of how many values and the width of the values.
Logical Tables are the tables we see created in the data model, i.e. fact and dimension tables. The Logical tables contain one row for each row of data. The tables do not contain the field values directly. Rather they contain a pointer to a value in the associated Symbol table. This pointer is sometime called an Index.
The width of a pointer is the number of bits required to index the number of values in the Symbol table. For example, in the image above we have 5 values for “Year”. This would require 3 bits as 2^3 is 8, which would cover the required 5 values. 2^2 would be too small as that would only cover 4 values.
MyQSDA Pro tool shows the memory required for each field, including a breakdown by Symbol and Index.
I’m going to use QSDA Pro for my demonstrations in this article.
Using less memory for fields involves reducing the size of the symbol table, the index, or both. There are four techniques we can employ to reduce field memory:
Eliminate the field
Reduce the number of field values
Optimize field values to reduce width, including AutoNumber
Reduce the number of rows
Let’s look at each of these options.
Eliminate the field
Removing the field from the data model is the easiest way to reduce memory :). Of course this is only viable if the field is not used by your application. To determine if a field is used, you must consider all the places a field may be referenced — master items, variables, charts, bookmarks, etc — for both public and private content. Fortunately, QSDA scans all public and private content and makes the inuse determination for you.
In some cases you will not want to drop a field as you anticipate it being used in the future. The benefit from removing fields is relative to the size of the field. When considering whether you want to drop a field, look to the largest fields first where you will gain the most benefit.
QSDA Drop Unused Fields Dialog
Reduce the number of field values
Reducing the number of distinct values will reduce both symbol and index space. How might we do this?
A common scenario involves timestamps. For example let’s look at a field named “ShipTime” which displays in our app as hh:mm:ss, reporting the time an order was shipped. The analysis requirement is that occasionally an analyst will need to see this value in an order detail chart. This field has 459,918 distinct values. Something seems off. There are only 86,400 possible hh:mm:ss values per day and we only ship during one shift so I would expect to see no more than 28,800 values.
When I examine the values in the app I discover the field contains an entire Datetime value and the display format hh:mm:ss is being used in the chart. I don’t need the date portion. I’ll use the Frac() function in the script to extract just the time.
Reload followed by a new QSDA Analysis and here’s the result below. A massive reduction in distinct values and associated savings in both symbol and index. This reduces the total memory for this field from 5200KB to 345KB.
Another potential scenario for this field is that the original developer required both the date and time. In this case our approach is to split the datetime into separate Date and Time fields like this. Remember that formatting functions like Date() and Time() do not change values, we must use numeric functions like Floor() and Frac().
If I need to display the “Ship timestamp” in a chart, I’ll do it like this in the chart:
ShipDate & ' ' & ShipTime
A QSDA analysis now shows a total of 863KB for both fields. A big reduction from 5200KB!
Other potential ways to reduce the number of values:
Drop seconds or fractions from Time fields.
Some accounting systems return fractional amounts, or you may have unneeded fractions due to a calculation. Round the final amount to the penny or appropriate magnitude.
Optimize field values to reduce width
Reducing the width of the field values decreases the Symbol space but not the Index space. How can we reduce the width of a value without changing the business meaning of the value? Isn’t a value a value?
We’ll start with the easy way — AutoNumber. The AutoNumber statement (and AutoNumber function) translates values into a set of sequential integers. This is useful for compacting key values. We typically don’t need to see the key values, we just need to them to link our tables together.
AutoNumbering a field is done by adding this statement at the end of your script:
Here’s the before and after sizes for SalesOrderDetailID, showing a total reduction of 143MB.
Before AutoNumber
After AutoNumber
Note that the symbol space has been completely eliminated! When the symbol set consists of sequential integers, Qlik does not store the symbols. Instead, the index value is used as a proxy for the symbol value.
Now we need to dive a bit deeper into the actual format of a symbol table. The symbol table diagram at the top of this post is a bit of a simplification.
Generally speaking, strictly numeric values can be stored in 8 byte cells. For a field that contains only numeric values the symbol table is an array of 8 byte values.
We can index to the nth value simply by multiplying by 8. This is a very efficient and compact storage format. In QSDA these fields will show an Average Symbol Width of 8.00.
QSDA Fields
For fields that contain strings, the symbol table layout is a bit different. As strings can be of varying length, an array of fixed cells won’t do. If there are any strings in the field, the entire field is considered “mixed”.
The symbol table for a mixed field is an array of 4 byte pointers that point to symbol values elsewhere in memory. The values consists of:
1 byte flag
The varying length string
1 byte null terminator
The total symbol space for a string is 6 bytes plus the length of the string. The storage for string “a” would be 7 bytes.
Looking at the “LastName” field in the image above, we know that each symbols value carries a 6 byte overhead. We can infer that the average length of the LastName strings is 6.54. That is, 12.54 – 6.
When the value is a Dual() value, the symbol value picks up an extra 4 or 8 bytes to hold the numeric value. 4 bytes is used for integers, 8 for decimal values.
The total symbol space for a dual value is 6 bytes plus the length of the string, plus 4 or 8 bytes.
A field may contain both string and dual types. Dual is a value attribute, not a field attribute. For more on that topic see “Dual Storage vs Dual Behavior“.
Ok, we’ve just gone down a deep rabbit hole. Maybe interesting, but is this important to reducing the overall memory footprint of your app? Generally no, sometimes yes. Let’s look at some examples.
Sometimes fields that are strictly numeric get inadvertently loaded as Dual() values. Certain operations including where clauses in loads can cause this behavior. Frankly, I don’t have comprehensive understanding of all the ways this can happen. But when it does happen, we can see numeric fields having a symbol size of more than 8.
The typical way to return these fields to 8 bytes (if you can’t fix the root cause of the issue) is to wrap the field with Num() or +0 when loading.
Num(UnitPrice) as UnitPrice
UnitPrice+0 as UnitPrice
I prefer neither approach. I typically use a TempFormat table instead.
Is it worth the trouble to fix these? At first glance it may look like a big deal, but the memory savings is typically small.
The UnitCost field occupies 40MB and the symbol width should be 8 instead of 13.45. Almost all of the storage is in the Index Bytes. The field has a relatively small amount of values. Making those 2,011 values 8 bytes each would save me a total of 10967 Symbol Bytes. (27055 – (2011 * 8))
All that said there are occasions when you have a larger number of distinct values and this can make a significant difference. I almost always “fix” these fields without giving it too much thought as it’s easy to do with a tool like QSDA.
Reduce the number of rows
Reducing the number of rows that reference a field decreases the Index space, but not the Symbol space.
Wait! Are you suggesting I load less data? No, I’m talking about data model changes that will not change the business value.
A typical opportunity to reduces rows is when you have very sparse data on a large fact table. Consider an OrderDetail table that includes return information on each Order Line. Only 0.5% of Order Lines get returned, so we end up with a lot of Index space pointing to nothing. This is indicated by a low Information Density for the table field.
QSDA Table Fields
These four Return fields in the SalesOrderDetail table require 23.28MB.
By moving these fields to a new “Returns” table, linked by SalesOrderDetailID, the Return fields and the linking key now require 227KB — a savings of 23MB, a relatively significant amount.
I hope you found some useful tips in this post. If you want to learn more about how QSDA Pro can help you optimize your Qlik Apps, join me on Nov 19 for the Click Less, Qlik More – QSDA Pro webinar or reach out to us.
Summary: I explain the mystery of why sometimes script fieldname changes flow through to expressions and sometimes not.
When adding a new field to an existing Qlik Script Load statement, where do you insert the new field in the field list? Top, bottom, alphabetically?
Where you insert the new field can break existing chart expressions — if you also rename fields using “as”. Let’s look at an example. We have an existing KPI using the expression “Sum(Sales)”.
If we modify our script to rename field [Sales] to [Total Sales]
Qlik will “automagically” update the field name in our KPI expression. Great!
What if we make the script change like this?
Our KPI is broken! No automagic! Why?
The System fields $Table, $Field, $FieldNo provide us a clue. “Sales” is the nth ordinal field in table “Orders”.
Automagic fix-up depends on the $FieldNo remaining constant. Inserting or deleting a field in the Load statement may change the $FieldNo. That’s when things break.
To avoid breaking existing expressions, follow these practices:
Don’t rename and restructure script in the same reload. A limited load of one row is enough to do rename fix-ups.
If in doubt, add new fields to the end of your LOAD statement.