
Qlikview Components (Qvc) is a script library that simplifies and improves the quality of Qlikview scripting. You can read an introduction to Qvc here.
Today I’ll talk about a couple of debugging and diagnostic routines in Qvc. Qvc has a Log routine that records messages in a Log table. The Log may optionally be written to an external file.
A call to the log routine is simply:
CALL Qvc.Log(‘message’);
Log adds ‘message’ to the Table Qvc.LogTable as fieldname Qvc.LogMessage. A sequence number and timestamp are added to the message. The Qvc.LogMessage field may be displayed in a chart or listbox.
Options such as writing to an external file are controlled by configuration variables. See the Qvc.Log doc for a complete list of options.
The Log routine is used by several other Qvc routines. Let’s look at one example.
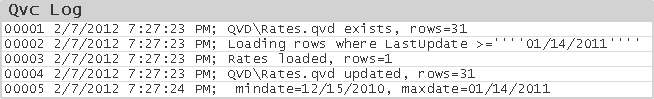
We sometimes want to know in script how a table’s row count is affected by an operation such as Join. The Qvc.TableStats routine displays a list of tablenames, row and field counts. The basic call is:
CALL Qvc.TableStats;
The output is written using Qvc.Log. If the optional parameter is provided, the message parameter will be included in the log lines to identify this call. For example:
CALL Qvc.TableStats (‘After Customer Join’);

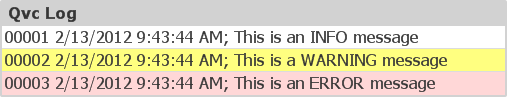
If you are using Qvc V1.1 (the latest as of this post), in etcQvcSheetObjects.qvw you’ll find an example chart that colors the log messages based on level.
It’s can be useful to record progress and status information during a script run. Qvc can make this a snap.
