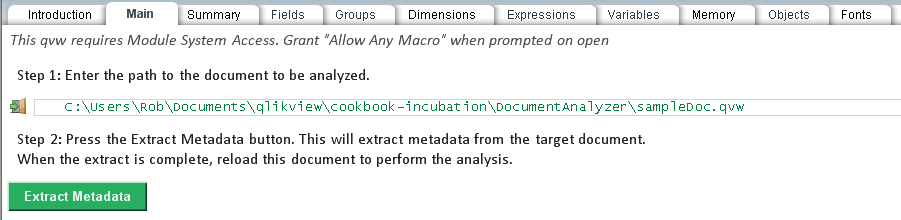
I was recently poking around in the QlikView 11 demo “Social Media Data Analysis“. This app was first brought to my attention in the excellent blog post “Use of a Silent Legend” by Jennell McIntire. I like how color is used to quickly create linkage between elements on the sheet. It’s one of my favorite tips.
Looking at the mechanics of the color & object construction, I thought that while fine for a demo, there were a few things I would do differently. One item in particular — the Company listbox — stood out because of a new technique available in QV11.

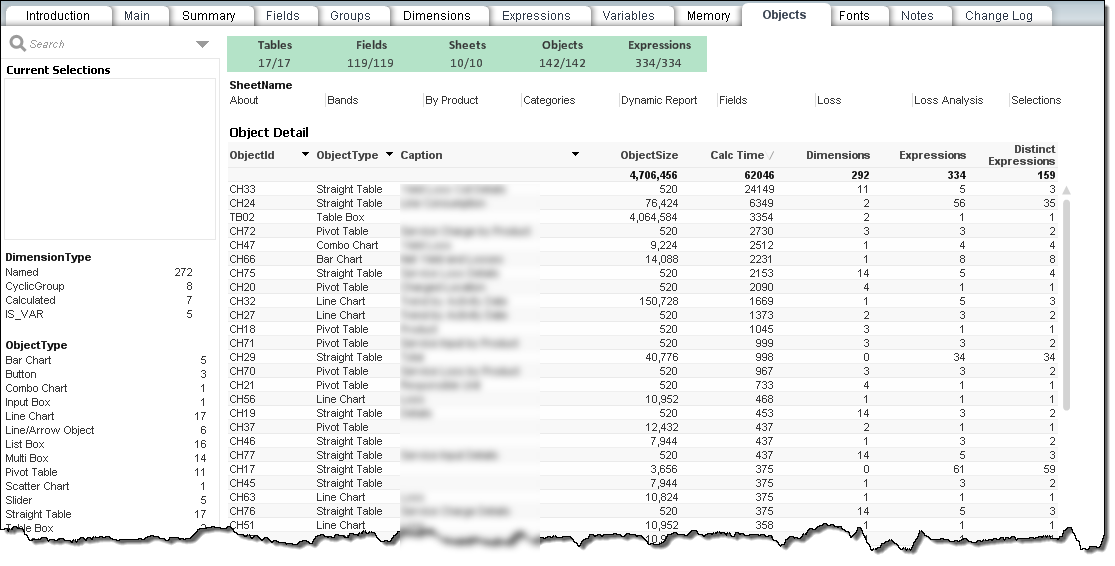
The listbox contains a color chip for each Company that maps to the color used in the charts. Very effective.
The color chips are constructed as 6 individual Text Objects. This is maybe the only possible way to get that particular effect in a V10 listbox.

However, that means that I, the challenged artist, have to line those boxes up and keep them aligned. It also means that I have to be very sensitive to the contents of the listbox changing.
V11 introduced Listbox Expressions which opens up a new option. I took the individual color boxes and put them in jpg files. I bundle loaded (embed in the qvw) the images with this script:
Images:
bundle info load * inline [
Company, image
Company A,image\Square_Orange.jpg
Company B,image\Square_Blue.jpg
Company C,image\Square_Green.jpg
Company D,image\Square_Brown.jpg
Company E,image\Square_Red.jpg
My Company,image\Square_Purple.jpg
];
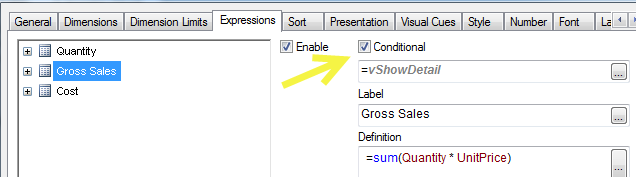
Next step was to add this Expression to the listbox:
='qmem://Company/' & Company
and select “Image” for the Expression Representation.
And now my color chips are an integral part of the listbox. Also, the chips now disappear for excluded values which is consistent with the visual behavior of the rest of the sheet.


I won’t be surprised if commenters come up with an even better way 🙂
-Rob