“Fastest” Method to Read max(field) From a QVD

Gather any group of enthusiasts together over a pint after work and inevitably there will be debate over what I call a “Pub Question”. Comic Fans will argue who would win in a fight between Batman and Spiderman, Web Programmers will debate the merits of Java vs .Net. For a group of Qlikview Script developers, the question may be “what’s the fastest script to get max value of a field from a QVD?”.

Qlikview has virtual Pubs in the Community Forums and blogs where these questions get raised. In a recent blog post http://qlikviewnotes.blogspot.com/2013/08/super-fast-method-to-retrieve-qvd-high.html I got some comments about this very question, including a couple of methods I had not tried before.

Let’s dispense with the Resident Table first. The fastest method for a Resident Table is loading the FieldValue()s.

LOAD Max(Id) as MaxId;
LOAD FieldValue(‘Id’, recno()) as Id
AUTOGENERATE FieldValueCount(‘Id’); 

This is much faster than loading From Resident like this:

LOADmax(Id) Resident data; 

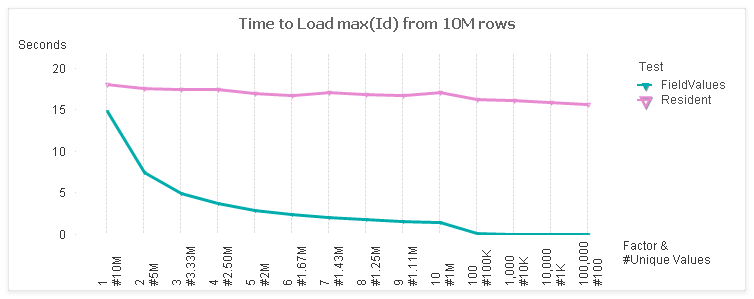
Here’s a comparison of the two:

For the test, I use a table with 10M rows and 7 fields. I vary the cardinality of the “Id” field from 1:1 to 100K:1. The x-axis of the chart shows the factor and the number of unique values (rows / factor).

The left side of the chart represents the maximum unique values at 1:1. The rightmost side of  the chart is least unique with only 100 values.  These ranges represent some real world cases such as:
1:1 — Primary Keys
2:1 — Timestamp values
1000 values — Date values

For a 1:1 case, there is not much difference between the FieldValues and Resident methods. However, as the number of values decrease, the FieldValue method follows in a linear trend. The Resident stays fairly constant as the same number of rows are being read.

Now on to the answering the “Fastest” when loading from a QVD. The answer, like all good Pub Questions, is “it depends”.  I ran timing tests on the following methods:

QVD :

LOADmax(Id) FROM (qvd); 

QVD-*/FieldValues:
LOAD * FROM (qvd);
LOAD max(FieldValue(‘Id’, recno())) 
AUTOGENERATE FieldValueCount(‘Id’);
QVD-DISTINCT-Field/FieldValues:
LOAD DISTINCT Id FROM (qvd);
LOAD max(FieldValue(‘Id’, recno())) 
AUTOGENERATE FieldValueCount(‘Id’);
QVD-DISTINCT-Field/Resident:
LOAD DISTINCT Id FROM (qvd);
LOADmax(Id) Resident table;
QVD-Field/FieldValues:
LOAD Id FROM (qvd);
LOAD max(FieldValue(‘Id’, recno())) 
AUTOGENERATE FieldValueCount(‘Id’);
QVD-Field/Resident:
LOAD Id FROM (qvd);
LOAD max(IdResident table;

Everything but the first case will be an Optimized QVD Load.

Here are the test results.

Surprisingly, the QVD only case is the winner for Factors 1-3, even though it is an un-optimized Load. This is not so surprising when you consider how data is stored in a QVD. The field values are stored in a symbol array, just like a qvw in RAM. Reading a single field would require only reading in those symbols. Combining the max() logic with this step would be efficient.

Note that the LOAD RESIDENT operation doesn’t benefit much from a deceasing number of values. At the 1:1 end, all techniques are processing the same quantity of 10M values. As we move to the right, LOAD RESIDENT continues to process 10M values (rows) while the other techniques benefit from lessor quantities.

Let’s drill in a bit. I’ll exclude the QVD-Field/Resident test (for scale) and narrow the Factors to the middle stuff, 4 – 1000.

And here’s the total time for those selections.

So…if I had to pick the “fastest”:
– For 1:1 cardinality, like Primary Keys or revision numbers, direct from the QVD is fastest.
– For most other general cases, Loading just the field and then processing Fieldvalues is fastest.

Of course, there are a number of factors beside the data profile that can impact the results. Disk speed, number of cores, etc. I’d love to hear if you have different experiences.

My colleagues at the upcoming October 9 Masters Summit for Qlikview in London and Barcelona may have some thoughts of their own on this question. In addition to core topics, Oleg is presenting “Performance Tuning” and Bill is presenting “Tips & Tricks”. Both sessions should provide some practical pointers for speeding up your apps. There is still time to register for the Summit. If you attend, perhaps we can continue this discussion at an evening “Pub Session”.

-Rob

Share

Autonumber() Key Fields and Sequential Integer Optimization

Today let’s reinforce some QV data model principles for us old timers and introduce a few tricks for newbies to Qlikview.

#1. Keys are not data. Key Fields in a Qlikview model should serve the data modeler, and not be used by chart Designers as data.

Consider two tables, OrderHeader (one row for each Order) and OrderDetails (one row for each Order Line). linked together by Field OrderID.


OrderID may be a value that you need to display in your charts. However, problems arise when you try to do things like count(OrderID). Which end of the connection should the expression count? It’s unreliable as discussed in detail here:
http://qlikviewnotes.blogspot.com/2010/01/best-way-to-count-keys-dont.html

The solution is to create a counter field on the table that represents the correct cardinality for the counter. If we are counting Orders, that would be the OrderHeader table.

In the LOAD of the OrderHeader table:

1 as OrderCounter

Part two of of the recommendation is to isolate the key field so it is not mistakenly used as a data field. We do this by prefixing the key field name with a special character and SETing the QV system variable “HidePrefix” to that character.

SET HidePrefix=’%’;

In the LOAD of both OrderHeader and OrderDetails:
OrderID as %OrderID

Fields that begin with the HidePrefix value will not show up in:
–  Current Selections.
– Dimension or Expression property dialog (unless “Show System Fields” is checked).

Of course, the specific values of OrderID may be useful to display in UI charts. In that case we must preserve it as a data item in one and only one table. We will include it in the LOAD of the OrderHeader table. Our data model now looks like this:


OrderID is available as a data field, but appropriately only from the OrderHeader table.

OrderCounter is now available as a field such that
=sum(OrderCounter)
will yield the correct Order count.

Now we (the Data Modelers!) own those “%” key fields! They are ours, we told the UI designers explicitly that “it is not data” .

Part three, and a very important part indeed, is to autonumber() the key fields. Autonumber() is a Qlikview lookup function that translates parameter values into integers. The sequential integers returned by autonumber() will reduce the RAM requirements and increase the linkage efficiency as detailed here
http://qlikviewnotes.blogspot.com/2008/05/memory-sizes-for-data-types.html
and
http://community.qlikview.com/blogs/qlikviewdesignblog/2012/11/20/symbol-tables-and-bit-stuffed-pointers

Admittedly, it gets a bit geeky. Bottom line, here is what you want to do for your keys:
autonumber(OrderID, ‘%OrderID’) as %OrderID

The autonumber() function converts values to sequential integers. The second parameter,  ‘%OrderID’, is important if you have multiple keys being autonumber() in your script.

To summarize:
#1. Keys are not data.
#2, Isolate keys using the “SET HidePrefix=x;” variable. Establish counter fields on the appropriate table.
#3. Use the Autonumber() function to convert key field values to sequential integers. This will minimize the memory footprint of the application and improve the efficiency of cross table look-ups.

My friend and colleague Barry Harmsen, author of QlikView 11 for Developers, who is a much wiser data modeler than I, will be discussing QV data modeling in depth with me at the Masters Summit for Qlikview in Europe this October. I hope you can join us!

Share

Super Fast Method to Retrieve QVD High Value

Delta Load, sometimes called Incremental Load, is the technique of pulling only changed or new rows from a database and then merging those rows with a master QVD. The Delta Load pattern follows these general steps:

1. Determine high water mark (“last reload”)
2. Build WHERE predicate in syntax of target DB.
3. SQL SELECT delta rows.
4. Merge delta rows with QVD.
5. If Deletes, INNER JOIN entire set of Keys from DB with QVD

The first step is to determine what cutoff value — delta point — do we want to pass in the SQL SELECT WHERE clause to identify new rows. This value is usually the highest value in the existing QVD.

The most robust and reliable method for step one is loading with max() from the existing QVD. For example:
LOADmax(LastModified) asMaxModifiedFROMmyqvd.qvd (qvd); 

This works well, but reading the entire QVD can take a very looooong time for a large QVD.

A much faster method is to aggregate the max value for the Delta rows only and then save that value on the first row of the QVD. In subsequent delta loads, only the first row of the QVD is read to get the value. This is extremely fast and is not effected by QVD size. For example:

Facts:
SQLSELECT * 
FROMmytableWHERELastModified>= ‘$(vMaxModified)’;

JOIN(Facts)
LOADmax(LastModified) asHighWaterValue
RESIDENTFacts;
// Do QVD Merge…and STORE Facts INTO Facts.qvd
Retrieve value later with:
 FIRST 1 LOADHighWaterValueFROMFacts.qvd(qvd

The “HighWaterValue” field will contain a relatively small number of values and will therefore have a negligible impact on the size of the QVD. You will of course have to create the field the first time before trying to load it with the “FIRST 1…”.

If you are using Qlikview Components (QVC) V8+ for delta loading, you can enable this high performance strategy by setting the variable:

SETQvc.Loader.v.StoreMaxModFieldValue = -1; 

QVC will automatically create a high water field named Qvc.MaxModFieldValue
and detect the availability of the field on subsequent loads. There is no need to pre-create the field before turning on this feature.

The technique is part of the Advanced Scripting material I’ll be presenting at the upcoming Masters Summit for Qlikview in Europe this October. I’ll be discussing more about Delta Loads, including strategies for merging large QVDs and tables with non-unique keys. Review the full agenda here and decide if the Masters Summit might help take your Qlikview skills to the next level.

Share

Quick Tip for Exploring Your Data Model

I picked up a great tip from QlikCommunity to view field values in your data model:
http://community.qlikview.com/thread/89396

I refined it a bit and am finding it very useful.

1. Create a listbox for field “$Field”.
2. Create a Straight Table Chart with:
  a) Calculated Dimension:  =$(='[‘ & only([$Field]) & ‘]’)
  b) Expression:  =sum({1}1)

Select a $Field in the listbox and the field values and frequencies will appear in the chart. Very handy for exploring data values in your model.

-Rob

Share

Book Review: Qlikview for Developers Cookbook

I just finished the excellent book “Qlikview for Developers Cookbook” by Stephen Redmond, available from Packt Press. The book contains approximately 100 short “how to” examples of Qlikview visualizations, calculations and scripting.

(Note: This book is not related to my “Qlikview Cookbook” available at http://robwunderlich.com/downloads/. The books are similar in aim, but Stephen’s is a full print book with entirely new content.)

This is an excellent reference for many QV tasks and a good way to learn no matter your level. I picked up quite a few new tricks. The book organization is good, the examples clear and short. The “How it Works” explanations are gems. Stephen’s experience is broad and he freely shares his advanced knowledge.

I highly recommend this book for all QV developers. You’ll recover the purchase price with one tip!

The book is available in print and e-book. The print version is in black and white, and I found some of the figures hard to understand without color. The e-book uses color and is much easier to follow, so I recommend the e-book.  Interestingly, at this moment, you can get the print and e-book together for less than the cost of the e-book alone. Go figure!

Congratulations to Stephen for an important contribution to the growing library of QV Publications.

Share

Calculating a Duration Using Two Rows

I’m always tickled to learn something new in QV, especially when it’s simple and elegant. swuehl, a prolific and respected contributor to QlikCommunity, answered this Community post with a brilliant solution.

The problem was how to calculate a Project (the Dimension) duration using dates from two different rows in the source table. I would have automatically reached for a script solution, Generic Load. But what if you don’t want to modify the script or don’t want the flattened model produced by Generic Load?

Swuehl’s solution computed the value in the chart using Set Analysis to fetch the needed values from the appropriate row.

only({<progress = {deployed}>} entry_date ) 
   – only({<progress = {started}>} entry_date)

The cleverness lies in using the only() aggregation function. Set Analysis can only be used in aggregation functions, so he used only() to enable specifying the Set.

I like it.

-Rob

Share

Masters Summit Coming to Europe

I’m excited to announce that the Masters Summit for Qlikview will be coming to Europe in October 2013. Two dates and locations are announced:

  London, UK 9-11 October 
  Barcelona, Spain 14-16 October

Join us in either location for 3 days of hands on sessions where we will bring some of the leading QlikCommunity contributors to you live to discuss advanced techniques in building complex solutions with QlikView. The goal of this event is to take your QlikView skills to the next level and help you become a QlikView  master.

The inaugural Master Summit was held in Las Vegas, Nevada, in April 2013, with over 60 attendees from North America and beyond. Check the website for feedback from attendees at the Vegas Summit.

Program details and registration information can be found on the Summit Website. I hope to see you in Europe!

-Rob

Share

Assigning Dual() Values With a Dummy Load

A clever customer reminded me of a useful script technique this week. Here’s the scenario.

A dashboard script was loading all fields from a qvd as:
LOAD * FROM data.qvd (qvd);

One of the fields, “Shipped”, was a flag field that contains the values 0/1. It became apparent in the dashboard UI that this would look better as a Dual() field with display values of Yes/No. It was agreed that the QVD should be modified to create a Dual(), but it will be some time before that change can be made. In the meantime, the change should be made in this dashboard script.

The Shipped field could be made a Dual() by modifying the QVD load statement in one of two ways.

1. Instead of “LOAD *”, list each field and apply the Dual() function to the Shipped field.
2. Add an additional field “Shipped2” and rename/drop to replace the Shipped field.

Both of these techniques share the downside of making the QVD load un-optimized, losing the speed advantage of optimized load.

Another possibility would be to create a Map with Dual() types and MAP the Shipped field:
MAP Shipped USING MyMap;
However, global mapping does not occur for optimized loads. To make the mapping work, you would have to force an un-optimized load.

Is there a way to change Shipped to Dual() while retaining the optimized load? Yes — here’s one way;

temp:
LOAD Dual(str,num) as Shipped INLINE [
str, num
Yes, 1
No, 0
];

data:
LOAD * FROM data.qvd (qvd)
;

DROP TABLE temp;

Before loading the QVD  we load a temp table with the field “Shipped” using the correct dual() values. The temp table is later dropped after the QVD is loaded. The key to making this effective is that you must uncheck “Survive Reload” for the Shipped field in Document Properties -> Number.

It’s an interesting technique and the extra blocks of code can be removed when the Dual() is eventually added to the QVD.

-Rob

Share

Masters Summit for Qlikview

I’m proud to be one of the speakers at the Masters Summit for QlikView, which will be held at the Four Seasons in Las Vegas on April 16 – 18.
In 3 days of hands-on sessions, Barry HarmsenBill LayOleg Troyansky and I hope to provide you with new knowledge and skills that will take your QlikView experience to the next level. We’ll be covering topics around advanced scripting, data modeling, expressions, visualization and much more. Besides an opportunity to invest in new knowledge and skills, this is also an excellent opportunity to network and exchange new ideas with your peers.
I hope you will be able to join us there. For more information, see the conference website.
-Rob
Share

Book Review: Qlikview 11 for Developers

I’m pleased to have just finished reading “Qlikview 11 for Developers” by Miguel Garcia and Barry Harmsen (Packt Publishing). This book covers a complete set of Qlikview development topics using a realistic sample application. The code and sample data are available for download and all materials work with Qlikview Personal edition.

The book is suitable for beginners and intermediates. Even as a highly experienced practitioner, I learned quite a bit from my read.

The authors do an excellent job of developing a sample application that covers most of the data modeling and analysis challenges you are likely to encounter in real world development. Following the tradition of the best programming guides, the application scenario is relevant and used consistently throughout.

In addition to covering the basics everyone needs to get started, the book gives a good treatment of advanced topics such as set analysis and aggr(). I was pleased to see use of real world advanced techniques such as storing point in time expressions in variables.

I was also impressed with the editorial layout of the book which I found very effective and easy to read. Good clean layout (like a great dashboard), good use of tips, the right amount of pictures and examples.

This is the book the QV Community has been waiting for!

-Rob


Share

Recipes for Qlikview Success