All posts by Rob Wunderlich

Identifying Unused Fields With DocumentAnalyzer

An first step to improving  the performance of a QV Document is to remove unused fields from the data model. A tool that can assist with this process is DocumentAnalyzer, freely available for download here.

I first blogged about DocAnalyzer in 2009. It’s since undergone a number of improvements and there is a whole new audience of QV Developers out there. I thought it was worth revisiting.

DocumentAnalyzer is a QVW that analyzes another QVW and identifies Fields that are unused by the UI. That is, Fields that are not used in expressions, dimensions or keys. These are fields that can probably be safely removed without affecting the user experience. I say “probably”, because DocAnalyzer is a guide; you must apply your own common sense and knowledge of the application before following it’s recommendations.

DocAnalyzer uses a macro that requires system access. Allow system access when prompted. The main sheet provides an input field for specifying the document (target document) to be analyzed:


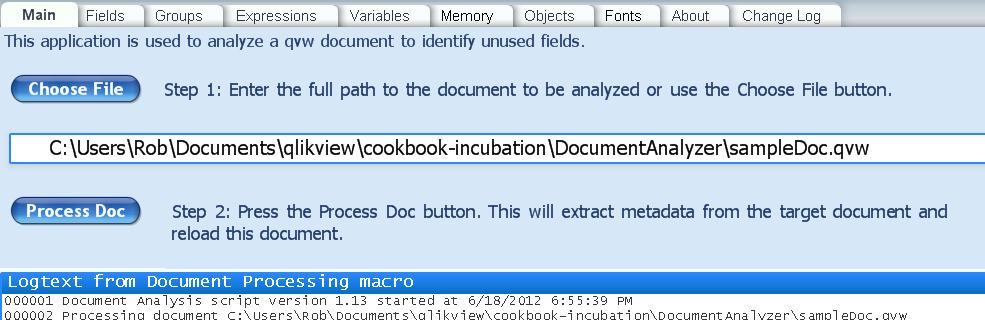
In the input field, enter the path to the target document. You may alternatively use the “Choose File” button to open a file chooser dialog. The usability of the chooser dialog is dependent on the windows version.

After entering a target name, press the “Process Doc” button. DocAnalyzer will open the target document and extract the info required for analysis. When the analysis is complete, you will see the popup


Press OK to continue and review the results.


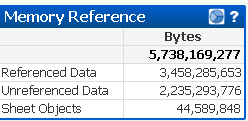
A good place to start is the “Memory” sheet. The Memory Reference chart will show how many bytes are represented by unused (Unreferenced Data)  fields, and therefore how much memory could be saved by removing those fields. In this example 2.2GB of data is unused!


Next go to the “Fields” sheet. Select “N” in the FieldIsUsed listbox. Sort the Bytes in the “Field References” chart. This will identify the amount of memory occupied by each unused field.


It makes sense to consider removing the “OrderTime” field. It uses about 90MB. The other fields are small. You may want to remove them for neatness but the impact on performance will be insignificant.

A field may be required as part of the script processing or it may have been loaded by a “LOAD *”. A simple way to remove it from the model is to add a
DROP FIELD OrderTime;
at the end of the script.

In addition to identifying unused Fields, DocAnalyzer has picked up a couple of useful features for understanding target documents.

– The Groups sheet show the composition of Groups and their use.

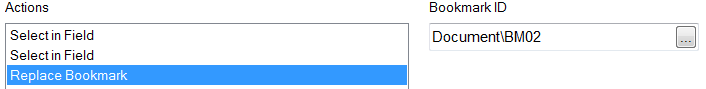
– On the Object sheet, select to a single objectId. Clicking the “Goto Object” button will take you to that object in the target document.

– A customer requested the ability to analyze consistent font usage in his application. While not really the mission of DocAnalyzer, I had the framework there I so added the Font sheet.

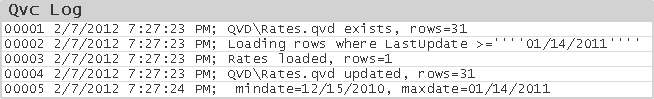
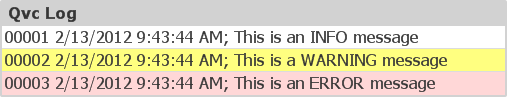
If you have problems or questions on DocAnalyzer, please follow the reporting instructions on the About sheet. If you are reporting a possible bug, please include the contents of the Logtext on the Main sheet in your report.

-Rob

Share

Script Diagnostics using Qlikview Components

Qlikview Components (Qvc)  is a script library that simplifies and improves the quality of Qlikview scripting. You can read an introduction to Qvc here.


Today I’ll talk about a couple of debugging and diagnostic routines in Qvc. Qvc has a Log routine that records messages in a Log table. The Log may optionally be written to an external file. 


A call to the log routine is simply:
  CALL Qvc.Log(‘message’);


Log adds ‘message’  to the Table Qvc.LogTable as  fieldname Qvc.LogMessage. A sequence number and timestamp are added to the message. The Qvc.LogMessage field may be displayed in a chart or listbox. 


Options such as writing to an external file are controlled by configuration variables. See the Qvc.Log doc for a complete list of options. 


The Log routine is used by several other Qvc routines. Let’s look at one example.


We sometimes want to know in script how a table’s row count is affected by an operation such as Join. The Qvc.TableStats routine displays a list of tablenames, row and field counts. The basic call is:
  CALL Qvc.TableStats;


The output is written using Qvc.Log. If the optional parameter is provided, the message parameter will be included in the log lines to identify this call. For example:
  CALL Qvc.TableStats (‘After Customer Join’);


If you are using Qvc V1.1 (the latest as of this post), in etcQvcSheetObjects.qvw you’ll find an example chart that colors the log messages based on level.


It’s can be useful to record progress and status information during a script run. Qvc can make this a snap. 

Share

Incremental Load using Qlikview Components

Qlikview Components (Qvc)  is a script library that simplifies and improves the quality of Qlikview scripting. You can read an introduction to Qvc here.

Today I’ll show you how to do Incremental Load (IL) using Qvc. Incremental Load means extracting only the latest changes from a database table and merging those changes with a master QVD file. Writing your own IL script can be rather tedious and frequently involves copy/paste operations followed by forgetful edit errors. Qvc can make it much easier.

Incremental Load is not necessary for every table. We typically use IL for large source tables. IL can reduce the elapsed reload time and impact on the database system by loading only new or updated rows.

To utilize Incremental Load a source table must have both of the following attributes:

  • A unique identifier — a Primary Key — for each row.
  • A “Modification”  column that identifies when a row was added or updated. The column type may be a Date, Datetime or ascending Revision number.
The classic IL logic is this:
  1. Determine the “Last reload Time”. The most robust technique is to extract the max value for the “Modification” column from the Master QVD.
  2. Select rows from the database table where “Modification” is greater than “Last Reload Time”.
  3. Add and update rows in the Master QVD, based on primary key.
Here is the complete Incremental Load script using Qvc.

// Include Qvc code
$(Include=..qvc_runtimeqvc.qvs)


// Calling parameters are QVTablename, UpdateColumn, PrimaryKey.
CALL Qvc.IncrementalSetup (‘Rates’, ‘LastUpdate’, ‘RateId’);  


// v.Tablename is set by IncrementalSetup
[$(Qvc.Loader.v.Tablename)]: 
// Whatever LOAD and SELECT goes here
SQL SELECT * FROM dbo.RateTable
// v.IncrementalExpression is set by IncrementalSetup
WHERE $(Qvc.Loader.v.IncrementalExpression);


// Update the QVD with the changed rows
CALL Qvc.IncrementalStore

That’s it.

You’ll also get useful log messages telling you what was done.

00002 1/17/2012 1:23:46 PM; QVDRates.qvd exists, rows=31
00003 1/17/2012 1:23:46 PM; Loading rows where LastUpdate >=”01/14/2011”
00004 1/17/2012 1:23:46 PM; Rates loaded, rows=1
00005 1/17/2012 1:23:46 PM; QVDRates.qvd updated, rows=31

Review the Qvc Documentation for explanation of parameters and configuration variables. The documentation also contains a working example.

Share

The Power of Gray

I’m sometimes asked by developers “How do I make un-associated (gray) data disappear from listboxes?”. After some discussion as to why they want to do this, I usually attempt to convince them to not hide any data.

Gray data is an important part of the power of Qlikview — the associative experience.  Associative is the way our mind connects data. When I try to recall a face I may narrow my candidates by an attribute like hair color or where we met. But I don’t forget everyone else. I just take them out of focus.

I recall one of my first Qlikview “Wow!” moments when I saw the power of the associative process. I was working with a Industrial Safety analyst who was studying the effectiveness of various glove styles in preventing hand injuries. We had a database of injuries and a separate dataset of glove models in use by period and location.

Up to this point, the analyst had been working from static reports that counted injuries of interest by looking for “where BodyPart=’Hand'”.

We loaded the data into Qlikview. BodyPart  became a listbox. He selected “Hand” and the table charts displayed the same counts as the static reports. In the gray data we noticed a significant number of injuries for “Hend”, a misspelling of “Hand”. A simple click added those into the total. The analyst also discovered “finger” and “fingers” were of interest and added those. Furthermore, for certain glove styles — those with a gauntlet sleeve —  “forearm” should be added.

With just a few clicks the Analyst had greater accuracy in this important work. It was the display of gray data that allowed this to happen, along with the ability to quickly convert gray to green (selected).

So while there may be edge cases where it’s necessary to hide gray data, I generally find that displaying all data in the associative manner is a unique and special advantage of Qlikview.

Share

Easy Period Analysis using Qlikview Components

If you think coding complex Set Analysis expressions and writing repetitive script is an efficient use of your QV development time, then this post is not for you. Go back to memorizing pi or whatever it was you were working on. For the rest of us, read on.

 
With Qlikview Components (Qvc) you can quickly build all the parts needed for many point in time and period over period analyses. Let’s walk through an example. 
 
Download the latest distribution (this article require V0.7+) of Qvc from the download link at
http://qlikviewcomponents.org. 
Unzip the distribution file anywhere on your disk. If you are new to Qvc, start by reading the ReadMe file.
 
Let’s assume our QVW contains a fact table of Orders with a field named “OrderDate” that we will use as the date for period reporting. 
 
Add this include at the beginning of the script to bring in the Qvc routines. 
 
  $(Include=..qvc_runtimeqvc.qvs);
 
After loading the fact table, generate a Master Calendar with this call:
 
CALL Qvc.CalendarFromField(‘OrderDate’);
 
The Qvc.CalendarFromField routine will build a calendar with dimension fields named  OrderDate, Day, Month, Year, Year-Month and Quarter. You can optionally include a language file to use your local language for the fieldnames — in this example Swedish.
 
$(Include=..qvc_runtimelanguageqvc_language_SE.qvs);
 
Now that we have a calendar, we can use any of the calendar fields in listboxes or chart dimensions. And… Qvc.CalendarFromField() also creates a collection of set analysis expressions stored in variables. The variables follow the naming convention vSetPeriod. For example:
 
vSetYTD
vSetPreviousYearYTD
 
The documentation for Qvc.Calendar provides a list of all generated vSet* variables. 
 
These variables in a chart expression like:
=Sum(Sum($(vSetPreviousYearYTD) OrderQuantity) 
which will sum up OrderQuantity for YTD of the previous year. The actual set analysis expression is rather lengthy but the variable is compact. 
 
I’d like to credit Mike over at iQlik for first teaching me the set analysis variable idea at http://iqlik.wordpress.com/2011/01/01/point-in-time-reporting-out-of-the-box/
 
Now we can quickly whip up a chart like this without coding any of the complex stuff:
The documentation supplied with Qvc provides examples for all Qvc routines. On the Documentation.qvw “Details” sheet select Qvc.CalendarFromField. You’ll be able to open a sample qvw where you can explore the vSet variables and learn how they interact with selections.
 
If you have comments or questions about Qvc, use the User Forum found on the project page.
Share

Introducing Qlikview Components

Qlikview Components is a set of Qlikview scripting subroutines. I started this project to address two problems. 


As a Consultant, I’ve written and left behind QV script for many different customers. I frequently use script subroutines for common tasks to simplify implementation and maintenance. As  Qlikview (and me) grows and matures, better scripting approaches and product features become available. What’s missing is an effective way to feed those improvements back in to the various versions of code I’ve spawned in the world. 


Another problem is that the flexibility of scripting is also a curse. There are many ways to do the same thing. What’s the “best” way? Do we all need to learn that variable loop and load thing? Many script tasks are like plumbing in a building. They are not that interesting (my apologies to Plumbers) but it is essential that they work correctly. We want to get them done quickly and move on to the interesting bits. 


How to address these problems? Enter “Qlikview Components” (Qvc), an open source (free) project. Here’s the mission statement from the project home page:

The mission of Qlikview Components is:
  • Implement scripting best practices encapsulated by a simple and stable API.
  • Improve the speed and quality of script development.
  • Create common ground between script developers.
QVC aims to serve the needs of the “big middle” of script tasks. Not the simple tasks, not the very complex tasks, but the garden variety common needs found in many scripts.
 
As an open source (OS) project, we have the opportunity to capture and redistribute the broad knowledge of the Qlikview Community. What do I see as the strengths of this project?
  1. The broadest possible input for design, validation and improvement of code. The project is hosted on google-code and allows for multiple developers around the world to contribute to the project. 
  2. A stable API. We’re committed to continuous improvement and compatibility.
  3. A unit testing regime that ensures quality.
  4. All the supporting pieces one would expect in a serious project — documentation, examples, localization, issue tracking, discussion groups, formal testing and build systems. 
Qlikview Components is currently in a “Preview” stage with a target for first production release on Feb 1, 2012. You can find the project at 
 
 
That address will redirect to the hosting site on google-code where you’ll find downloads and links to discussions. 
 
I’ll be blogging more on Qvc in the coming weeks. In the meantime, here’s a taste of what it takes to build a typical master calendar using Qvc. 
 
$(Include=..qvc_runtimeqvc.qvs);
// Load fact tables, etc…..

CALL Qvc.CalendarFromField(‘ClosingDate’);
 
I hope you’ll find Qvc useful and look forward to hearing your ideas for improvement in the discussion groups!


Share

Initial Selections and Current Selections

I’ve posted in the past about setting “dynamic” (based on date) initial selections. The easiest method from the Developer perspective is to apply search expressions, save them in a bookmark, and apply the bookmark as an OnOpen action. The bookmark may also be selected by the user at any time to return to initial selections.


For example, to select the current year and month:


=Year=year(today(1))
=Month=month(today(1))


This selects the correct Year and Month. However, the current selections display is poor.  The search expression, rather than results, is displayed in the Current Selections box.

Alternatively, those same dynamic selections can be achieved via Actions assigned to the Document OnOpen Trigger. Using Actions will present a cleaner current selections view. Here are the two Actions we should assign to OnOpen to achieve the same selections — but with a better looking current selections display at the end.

The Current Selections Display will now be much more comprehensible to the user.

Can we provide a way for the user to return to the dynamic initial selections by utilizing a bookmark? Yes we can. Create a new bookmark, assign it an appropriate name (like “Current Period”) and note its ID (for example “BM02” — from the Bookmark, More menu). Add one more action to the OnOpen trigger.

The selection values will be calculated and the bookmark updated with the new values each time the document is opened. 


-Rob

Share

Correct Time Arithmetic

Each time value in Qlikview has  both an external display string value and an internal numeric value. The numeric value ranges from 0 to 1 and is calculated as time/24 hours.  For example, 12 noon is represented as 0.50. 
 
Rounding during arithmetic can yield time values that share the same same external string but have a different underlying numeric value. The numeric value is used to group values in listboxes and chart dimensions. This is why you can sometimes see the time “01:00” display twice in a listbox or chart dimension!
 
Both of the time values below will display as “8:00:00 AM”. But they will not group together in the same dimension bucket on a chart.

8/24 = 0.33333333333333
MakeTime(8) = 0.33333333334303
 
 
I’ve seen a number of methods to do time and interval calculation. Some methods will have problems with certain time values. 


Look at some examples below and how they would match up with QV times, such as those read from databases or created by QV time functions. 

MakeTime(8) =     time#(’08’, ‘hh’)     True
MakeTime(8) = 8/24 False
MakeTime(8) – MakeTime(1) = MakeTime(7) False
MakeTime(4) – MakeTime(1) = MakeTime(3) True
time#(’08’,’hh’) – 1/24 = time#(’07’,’hh’) False
time#(’04’,’hh’) – 1/24 = time#(’03’,’hh’) False
time#(’08’,’hh’) – time#(’01’,’hh’) = time#(’03’,’hh’) False
time#(’12’,’hh’) – MakeTime(3) = time#(’09’,’hh’) True
time#(’08’,’hh’) – MakeTime(1) = time#(’08’,’hh’) False
time#(time(MakeTime(8) – MakeTime(1))) = MakeTime(7) True


The only reliable and 100% consistent method is the last line. The method is: use Qlikview functions to represent times and convert the result of calculations to time strings and back to time numbers again.


Breaking down the  example: 


1. MakeTime(8) – MakeTime(1) give us a display value of  7:00:00 AM. But as you can see previously in the table, it’s internal value is not exactly equal to MakeTime(7) — the value Qlikview considers to be 7 AM.


2. Convert the value of the calculation to a string using the time() function. The result is “7:00:00 AM”.


3. Convert the string into a numeric time using the time#() function. We now have the QV value for 7 AM which is equal to 7 AM read from a database or generated from any QV time function.


The same problem and solution applies to Timestamps and Intervals.


What we really need is a new “AddTime()” function, similar to the AddMonths() function. I sometimes create a variable function in my script to perform this function.


SET AddTime=time#(time($1 + $2));


Then I can use it in script or charts as:


$(AddTime(mytime,-MakeTime(1)))


-Rob


Share

The Case Against Caption Icons

I avoid using Caption Icons in sheet Objects. I prefer to teach users to right-click to access the same functionality. In V10, there is also the option to use a  “Menu” caption icon that provides the same options as right-click.

Here are my arguments for not using caption icons that duplicate the functionality available in right-click.

Note: I realize there are some limitations in the Ajax client prior to V9 that may require icons. My comments are directed at V9+.

  1. The redundancy and visual clutter waste screen space and distract from the data. If you are a fan of Edward Tufte’s work, you’ll recognize this as “low Data-ink ratio” and “Chartjunk”.
  2. They deemphasize icons that may be unique and important to a specific chart. These are things you want the user to notice, for example Help or Fast Change.
  3. They force the designer to display a Caption even when a Caption is not desirable for the layout.
  4. They keep users ignorant of the full power available, leading them to believe that they are limited to the functions offered by the displayed icons. Have you ever received a change request like “Please add the export to Excel function to chart X so we can export it.”?
  5. Also on the ignorance theme, users don’t become aware of new functionality if you don’t add the new icons.
Comments and counter arguments welcome.
-Rob
Share

My Top Two Feature Requests

There are a couple of missing features in QV that cause me to often bump my head against the ceiling. I have a great idea but then ouch — can’t make QV do that. Below are my top two feature requests. With all the cool, advanced, sophisticated ideas floating around out there, you may be surprised that my requests appear so basic.

#1. An escaping or alternate syntax for string literals that contain single quotes. I frequently use script subroutines and variables with parameters to bring discipline to my QV projects. Parameters are passed as strings and variables are sometimes themselves function calls that contain quoted parameters. Nested routines make the problem even more complex.

There is also a problem using SET and LET in script to define reusable expressions. The defined values often contain quotes.

Quoted strings cannot contain quotes, so I resort to all kinds of workarounds — & chr(39),  proxy characters for quotes and using fields when I would really prefer variables. All of these are complex workarounds that make my code resemble the Twister game.

#2 Grouped Objects. So many great screen objects available. Wouldn’t it be wonderful have a couple of charts, a listbox and an explanatory text box minimize & restore as a group? I’ve blogged about this in the past if you want to read more on the topic. So much could be done in the UI with the addition of object groups.

I’ve dropped both of these feature requests in various Qliktech “suggestion boxes” over the years. I have no idea if they will ever  be implemented or not. I frequently hear other users asking for #2, and I occasionally meet someone who shares my desire for #1.

What are your top two feature wishes?

Share