You’ve probably heard of the QV “Dual” function and may have seen some interesting uses for dual(). One of my workhorse applications of Dual is flag fields.
In script, we might create flag fields such as:
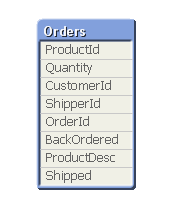
if(Not IsNull(ShipDate), 1, 0) as Shipped
This creates the new field “Shipped” that contains 1 (if the corresponding ShipDate has a value) or 0. This is a useful flag for chart expressions like “if(Shipped, …” or “sum(Shipped)” or “OrderTotal * Shipped “.
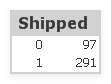
If we display the flag in a Listbox or Table, it looks ugly. 0’s and 1’s are appreciated only by programmers.
If instead of 0/1 we assign string values like “Yes”, “No” the display would look better.
But if we use string values, we lose the ability to use numeric expressions. Instead we would need to use slower string expressions like “if(Shipped=’Yes’,…)” and “count(Shipped).”.
Wouldn’t it be great if we could have the best of both worlds? Strings for display and numbers for convenience and performance? This is where dual is useful.
A quick review of the function from Help:
dual( s , x )
Forced association of an arbitrary string representation s with a given number representation x.
What this means is that a field value will have both string and numeric values — a dual nature. Which type is used — string or number — is dependent on the context where the field is referenced.
Let’s define that Shipped flag using dual:
if(Not IsNull(ShipDate), dual(‘Yes’, 1), dual(‘No’, 0) ) as Shipped
We are still assigning one of two choices to Shipped. The assigned values have a dual nature. Qlikview will use either the string or numeric value automatically based on how the field is referenced.
In a display context like a Listbox or dimension, the string value (“Yes/No”) will be used.
In a numeric expression like “sum(Shipped), the numeric value (0/1) will be used.
What about the “(If(…” test? QV will choose a numeric or string comparison based on the presence of quotes. All three of these examples are valid:
If(Shipped, …
If(Shipped=1, …
If(Shipped=’Yes’, …
In practice, I may create many 0/1 flags in a single script. Rather than clutter the syntax with a lot of repetitive dual(), I use a mapping approach.
First I define my map:
YesNoMap:
MAPPING LOAD num, dual(str, num) INLINE [
num, str
0, No
1, Yes
];
Then I identify the fields I want to assign to dual() with MAP USING statements:
MAP Shipped USING YesNoMap;
MAP Audited USING YesNoMap;
Later in the script I create the flag fields using the simple 0/1 assignments:
if(Not IsNull(ShipDate), 1, 0) as Shipped
MAP USING will translate the 0/1 into the desired dual. This approach also makes it easier to globally redefine my display values from “Yes/No” to “Y/N” or “Si/No”.
-Rob